What You Need to Know About Your Labor to Revenue Ratio
Reading Time:

Lead the pack with the latest in strategic L&D every month— straight to your inbox.
SubscribeThe labor to revenue ratio shows how well you utilize labor and resources to drive business success.
It helps answer the real questions leaders wrestle with: Are we using the right talent in the right roles? Are labor costs proportionate to the value generated? And, most importantly, are we getting the return on investment we expect from our people?
This isn’t just a finance metric. It’s a workforce strategy metric. Done right, it helps you see whether workforce investment is paying off—or holding you back. The key isn’t just cutting costs, but making every dollar spent on people directly impact performance.
What is labor to revenue ratio?
The labor to revenue ratio measures the amount of money an organization spends on employees compared to the amount of revenue generated. In short: it’s a measure of how efficiently your workforce converts cost into value.
What is inefficiency?
Inefficiency in this context means labor resources aren’t optimized to generate revenue. Common culprits include:
- Overstaffing. Too many employees for too little work inflates costs and reduces productivity.
- Poorly utilized resources. Having the right people in the wrong roles prevents output.
- Inefficient processes. Outdated, manual, or duplicated processes take employees away from value-adding work.
At Acorn, we built the first performance learning management system (PLMS) to help address this challenge. A PLMS codifies and operationalizes capabilities, ensuring every employee is building the right capabilities for the roles your organization needs. That way, training isn’t a sunk cost—it’s a direct driver of productivity and ROI.
Do you need to measure labor to revenue ratio?
Short answer: yes, because it gives leaders a clear, comparative measure of efficiency.
It’s important to remember that this isn’t the same as revenue- or profit per employee, which look at how much revenue or net profit is generated by individual employees, although it does help with understanding labor productivity. Instead, the labor to revenue ratio is about comparing total revenue with the total labor cost.
Measuring labour to revenue ratio gives you information with which to make more informed decisions.
- Highlights efficiencies and inefficiencies. A high ratio may mean workforce costs outweigh contributions. On the other hand, a low labor to revenue cost indicates that your employees are already working as effectively and productively as possible.
- Enables benchmarking. A good labor to revenue ratio varies depending on industry, the company’s age, and the company’s size, meaning you can benchmark the performance of your business against similar competitors to get an understanding of how well (or not-so-well) your business is operating.
- Identifies opportunities to reduce costs. If costs are disproportionate, your ratio highlights where labor deployment or training needs to shift.
However, there are also challenges associated with measuring your employee labor percentage.
- Capturing data. Managing labor costs is hard to do, because the total cost of the workforce isn’t just about the sum of wages paid for hours worked. It also includes indirect costs and overhead, such as insurance and benefits.
- Identifying inefficiencies. The ratio shows that a problem exists, but not where. That requires using it in tandem with other workforce metrics.
- Variations in revenue. Revenue isn’t a fixed value, and we don’t just mean that it moves in an (ideally) upward trajectory. Seasonal shifts, supply chain costs, or leave cycles can skew results.
- Limited insight into business performance. Because good labor to revenue ratios vary between industries as well as company size and age, it can be hard to understand performance based on your labor to revenue alone. Again, you need to combine it with other HR and business metrics to get the full story.
In other words: measuring labor-to-revenue gives you the signal. Linking workforce investment to performance tells you what to do about it.
How to calculate your labour to revenue ratio
The formula is simple:
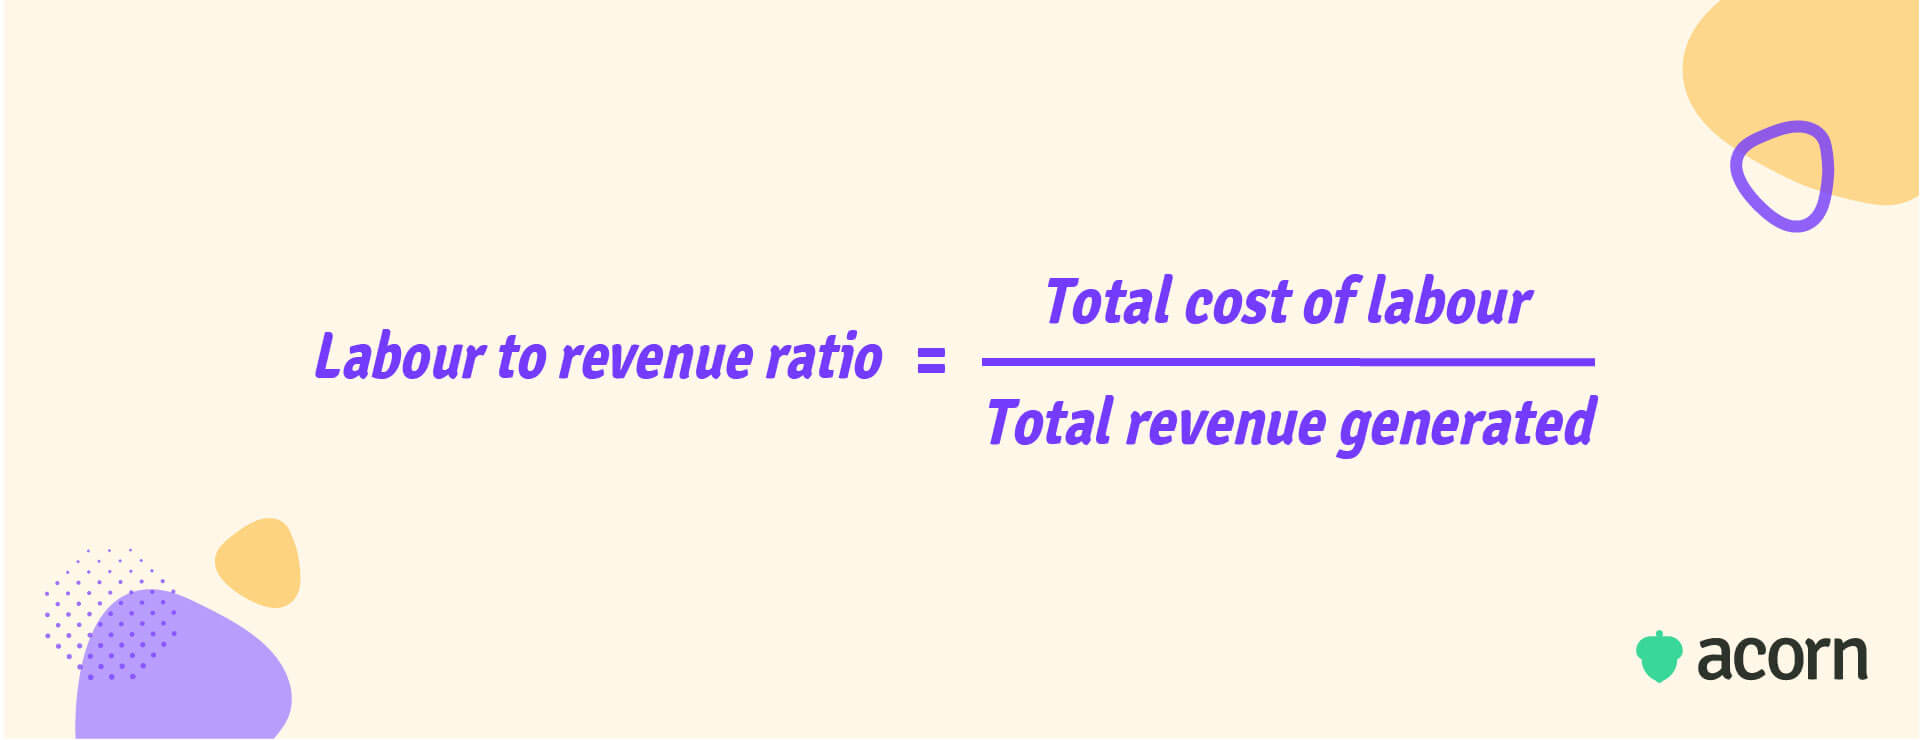
For example:
- If your labor costs = $500,000
- Revenue = $2,000,000
- Labor to revenue ratio = 0.25 (or 25%).

That means for every $1 in revenue, $0.25 was spent on labor.
As we said before, though, calculating the total cost of labour can be tricky. Everything involved in keeping workers employed at your business is a contributing factor to the total cost of labour.
You should include:
- Salaries and wages
- Overtime
- Benefits and paid leave
- Payroll taxes and insurance
- Recruitment and turnover costs
- Training and development costs
That last one—training—is often overlooked or misclassified as a sunk cost. But with the right systems, training becomes the lever to improve both productivity and retention.
Best practices for optimizing labor to revenue ratio
Recruiting a new hire costs up to $4,000 on average in US companies. That, plus lost productivity in the interim before your new hire is onboarded and brought up to speed impacts profitability. But optimization doesn’t just mean cutting costs. It’s about ensuring your workforce is capable, engaged, and productive enough to generate higher returns.
Invest in employee training and development
Training existing employees to build the right capabilities is far more cost-effective than constantly recruiting replacements and the biggest lever for long-term success.
The key is alignment. Training must be tied directly to the capabilities that drive business performance. A PLMS makes this possible by:
- Mapping capabilities to roles
- Mapping proficiency levels to learning content
- Assessing capability gaps at frequent intervals (roughly 6-8 weeks)
- Identifying gaps across your organization to understand where to invest in training.
It goes beyond “course completions” to capture evidence of on-the-job application, using manager feedback, evidence of performance, and performance metrics that connect to business outcomes. Leaders can then see—with data—whether capability uplift correlates with outcomes like higher productivity, stronger retention, and increased revenue.
Streamline and automate processes
Outdated HR workflows, manual reporting, and siloed systems eat into productivity and inflate labor costs, contributing to a loss of $1.8 trillion a year for US businesses.
Automating tedious tasks like reporting, approvals, or even surfacing learning recommendations reduces the hours employees spend on low-value work. In L&D specifically, AI-powered PLMSs can recommend role-relevant training based on specific capabilities, cutting down time wasted finding learning content, while ensuring capability uplift is timely.
Spending hours writing job descriptions? Create them in minutes with our AI Job Assistant.
BUILD YOUR DESCRIPTIONBuild engagement in the workforce
Employees who are more engaged in their work meet better performance outcomes and generate greater revenue for the business. But engagement isn’t about casual dress codes and ping-pong tables—it’s about employees giving meaning and growth in their roles.
When employees understand how their learning links to organizational performance, they feel more motivated to perform. Recognition, fair pay, and participation in decision-making reinforce this, but capability-led development is the foundation. It ensures employees see not just what they’re doing today, but how they’re growing toward future opportunities—keeping top talent nurtured within your organization.
Regularly monitor and adjust labour costs
Labor costs aren’t fixed. There are always wage expectations, healthcare costs, and shifting workforce demographics to consider. A ratio that appears lean against peers may actually signal under-investment, risking disengagement or attrition.
That’s why labor-to-revenue needs regular monitoring, not a once-a-year snapshot. Benchmark both direct costs (wages, benefits) and indirect costs (turnover, training, recruitment) against industry standards. This ensures your ratio reflects true efficiency, not underpayment or hidden expenses that will create bigger problems down the line.
Set goals and track key performance
Ratios provide signals, but they don’t define success. Leaders need to set specific workforce KPIs that tie labor spend to organizational outcomes. These could include revenue per employee, retention rates, reduced time-to-proficiency, or capability uplift in critical roles.
Traditional LMSs can’t provide this level of insight, since they measure completions rather than outcomes. A PLMS, on the other hand, tracks behavioral change and proficiency growth. That means you can measure whether training investments are delivering business impact — and adjust strategies with confidence.
Identify areas of inefficiency
Finally, remember that the labor-to-revenue ratio is a blunt instrument. A high ratio could mean overstaffing — or it could mean outdated systems, high turnover costs, or low engagement. Without context, it’s just a number.
Pair the ratio with other HR metrics like absenteeism, engagement surveys, or turnover type (voluntary vs. involuntary) to pinpoint where inefficiencies live. With that insight, you can design targeted interventions — whether that’s automating tasks, restructuring teams, or building leadership capabilities — that address root causes and bring costs back in line with value.
Key takeaways
Labor-to-revenue ratio is a useful signal, but only when paired with context. Optimizing it means cutting process waste, retaining and engaging talent, and investing in the right capabilities. Turnover and disengagement cost billions each year, so building capability and clarity into development is essential.
Think holistically about feeding a healthy ratio, and:
- Invest in training and development
- Streamline and automate processes
- Build employee engagement
- Improve retention
- Regularly monitor and adjust labour costs
- Set goals and track performance
- Identify areas of inefficiency.