How to Generate Capability Reports Using Capabilities
Take the first step towards workforce visibility with a capability report
We’ve all sat in “performance reviews” that devolve into vibes-based performance scoring. A capability report is the antidote. It anchors decisions in shared evidence—what capabilities exist within your organization, how proficient people are in them, and where targeted learning will drive performance
In this guide, we’ll walk you through how to generate a capability report step-by-step, using Capabilities.
What is a capability report in Acorn?
Capability reports are configurable reports used to view and analyze capability data across your organization. It displays capability sets, individual capabilities, and proficiency levels by user, alongside any standard or custom user fields you choose to include, allowing you to get a quick overview of the capabilities within your organization.
From there, you can use that information to identify and understand:
- Business-critical gaps, based on capability and proficiency distribution. Maybe you need to scale your sales team, but you don’t currently have any sales-related capabilities. Or maybe you do have sales capabilities, but they’re not as developed as you’d like. Either way, it’s a snapshot you can use to determine where you should prioritize change management.
- Strengths and gaps by capability set based on proficiency distribution. E.g., your team needs to develop more of their skills in various customer service capabilities, or maybe your sales team is excelling in theirs.
Capability reports also look at “assigned” and “interest” capabilities. Assigned capabilities are required role-specific capabilities (better capability proficiency = getting better at your job (and even getting a foot in the door for advancement). Interest capabilities aren’t tied to an individual’s job role, but can assist in lateral career mobility—advancement doesn’t have to mean climbing the corporate ladder anymore.
And with the implementation of AI across the industry, roughly 40% of the workforce will need reskilling in the next three years. A snapshot of where your organization is at right now will help you define your L&D priorities going forward.
How to generate a capability report (in Acorn)
To generate a gap analysis report using our platform, you’ll first need:
- The Capabilities module switched on
- A connected LMS, not necessarily Acorn
- A capability framework, your own or pulled from our Capability Library.
The ability to generate reports is limited to administrators, supervisors, and reporting officers.
Step 1: Select new capability report
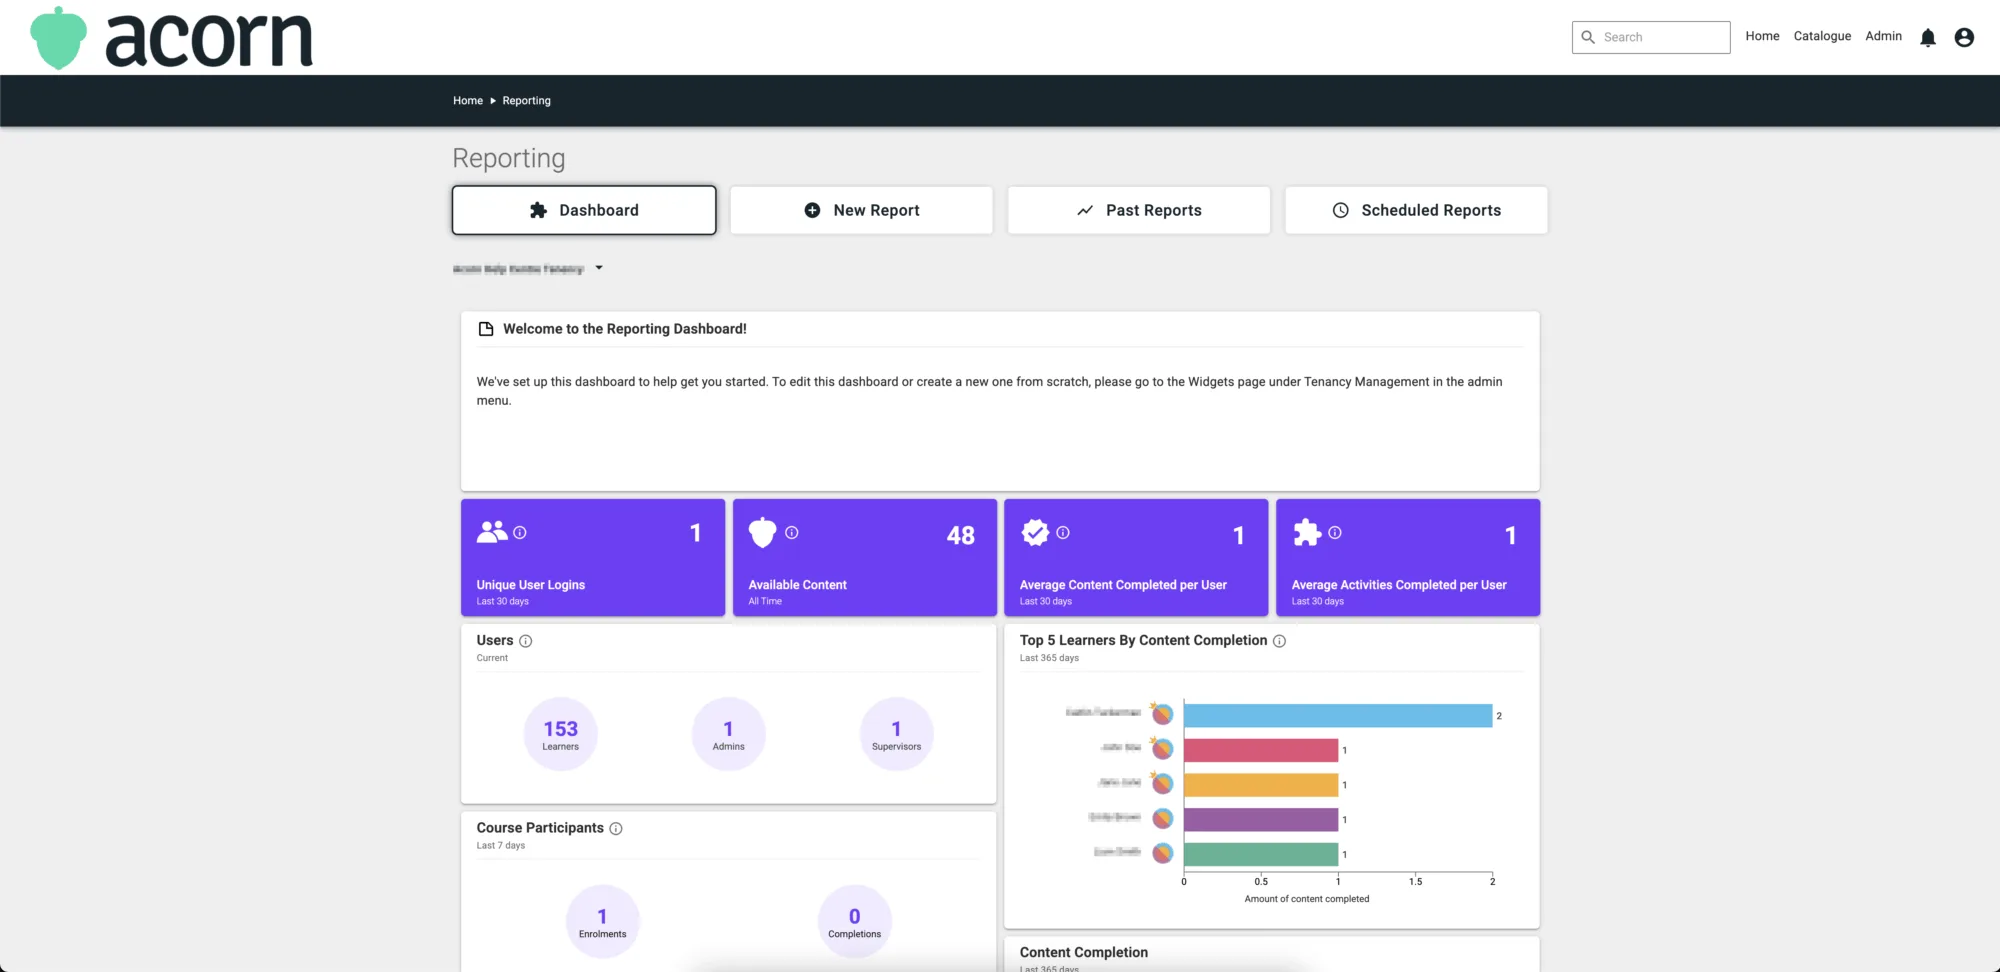
Through your Admin menu, scroll down to Reporting and click Reports. Once you’re in your Reporting Dashboard, select New Report from the top of the dashboard, and find Capability Report in the list of report types.
Step 2: Choose field settings
Customize what you want the report to cover with the field settings. You can filter by capability and restrict by user fields. You can also leave all fields blank, which will run a report on all capabilities and capability sets within your tenancy.
Filter by capability
You can choose from:
- Capability set
- Capability
- Proficiency.
If you select a capability set, then the report will run on the capability set you chose and break down all the users with assigned or interest capabilities in that set, and their proficiency level.
When you select capability, it will run the report for that particular capability and include users who have it assigned or marked as an interest, as well as their proficiency.
When you choose proficiency level, it shows all users who have achieved the specified proficiency level in any capability. If you filter by Advanced level proficiency, the report will include every user who has achieved Advanced proficiency in any capability.
You can also choose any variation of these filters to further restrict what the report shows (bear in mind, the more data to report on, the longer it will take for the report to generate).
Include user fields
User fields are included in the final report. If you select “department” under user fields, then the report will include a column listing the department each user is from so you can see how capabilities are distributed across your workforce.
When you select a user field, a text field option appears. You can leave this field empty, or you can enter a value if you want to restrict users who appear in the report. For example, if you choose “marketing” under the department field, only users in the marketing department will be included in the report, even if there are customer support or sales people with the same capabilities.
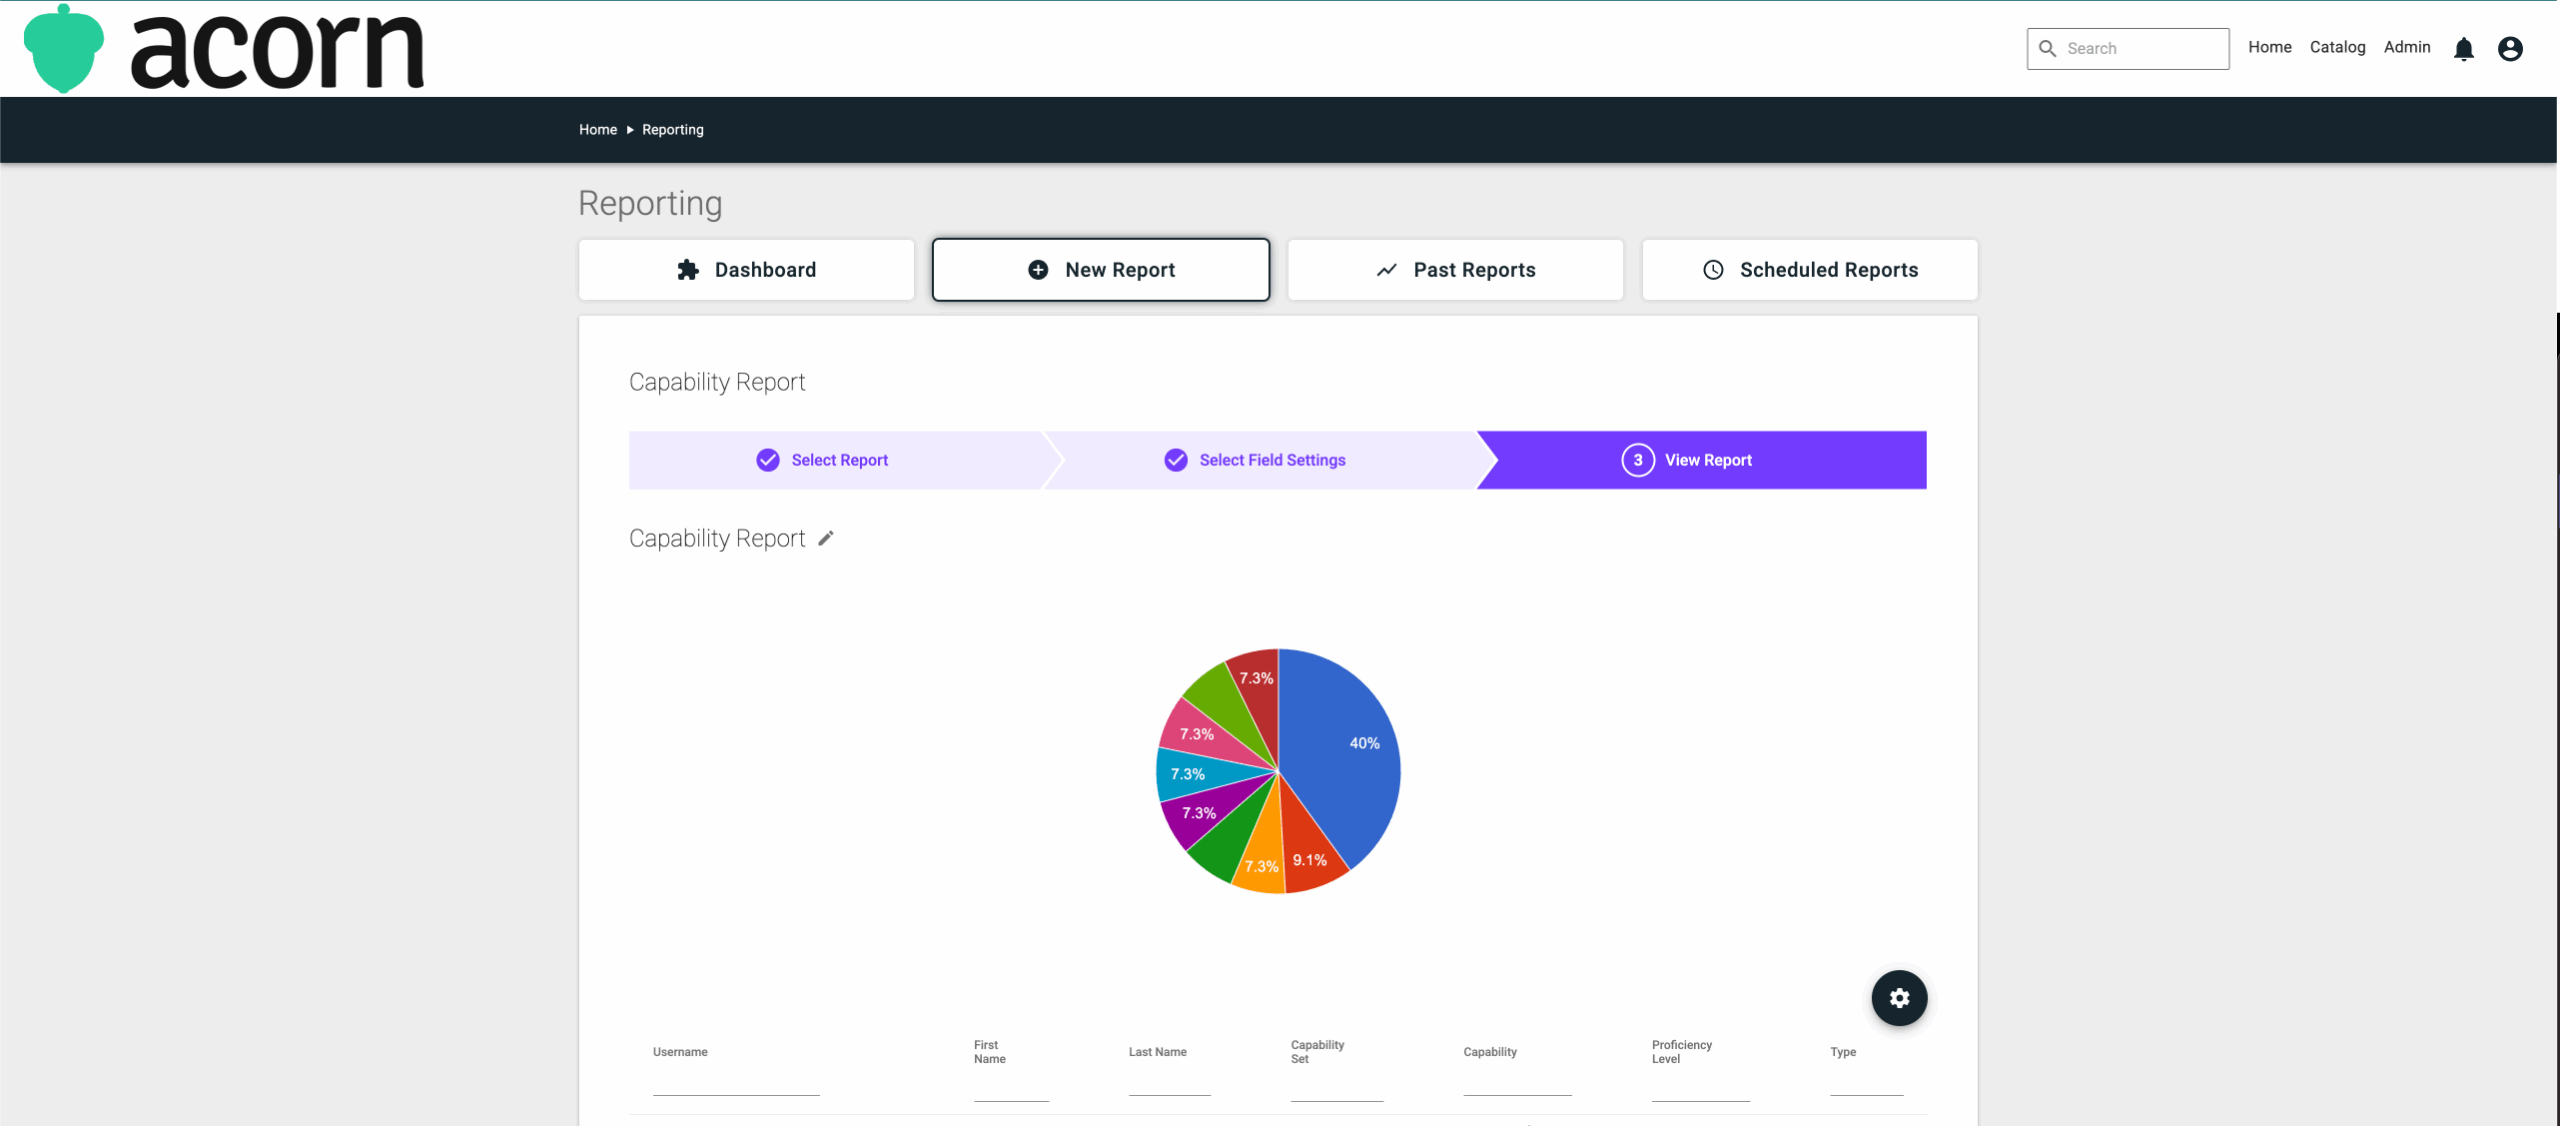
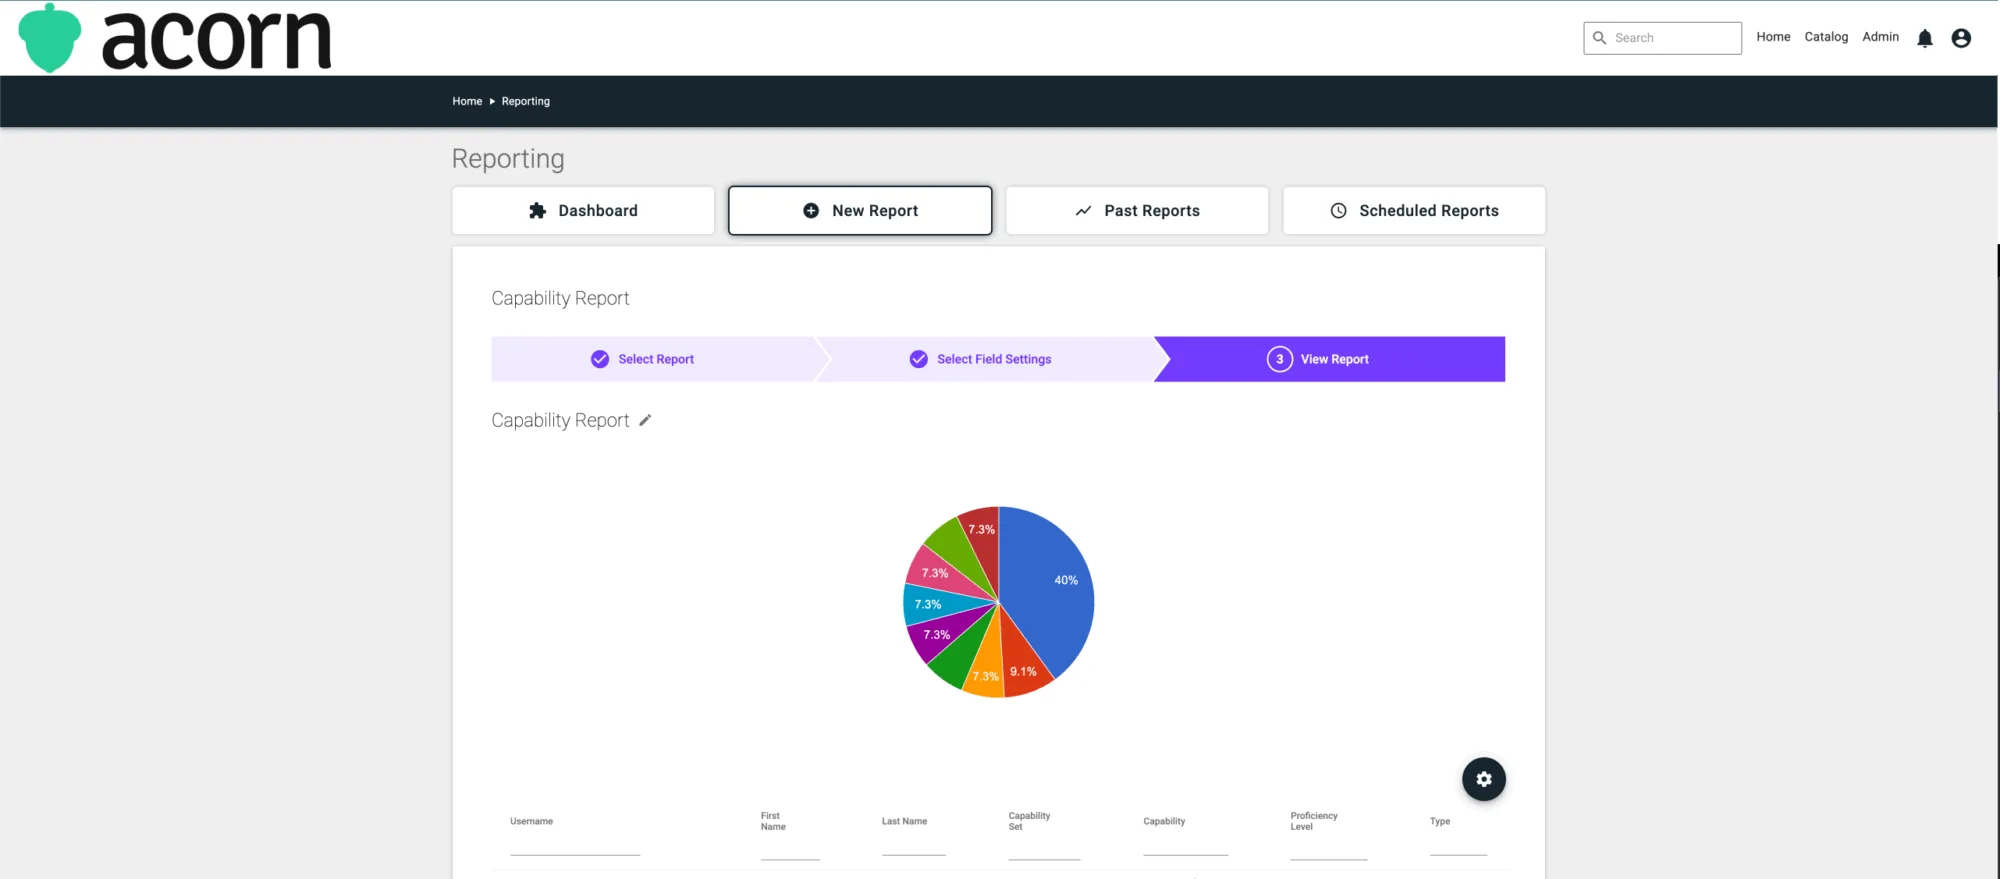
Once you’ve selected any filters or fields, click Next to generate your report. It will appear in two parts:
- A pie chart breaking down the distribution of capabilities
- A more detailed list breaking down users and their capabilities and proficiencies in more detail.
Final thoughts
Capability reports visualize capability sets, capabilities, and proficiency by user with your chosen user fields, and export cleanly to CSV file for analysis.
You can find more technical how-to resources, explainers, and definitions in our Help Center.