What Revenue Per FTE Can Tell You About Productivity
Reading Time:

Lead the pack with the latest in strategic L&D every month— straight to your inbox.
SubscribeRevenue per FTE reveals the health and productivity of your workforce.
Business leaders want to know that they’re operating efficiently, with the right talent in the right jobs, and what better way to find that out than by measuring your company’s revenue per full-time equivalent employee?
In this article we’ll discuss what affects your revenue per full-time equivalent employee ratio, how you can calculate it, and the best ways to increase it for your business.
What is revenue per FTE?
Revenue per full-time equivalent (FTE) is an HR metric used to measure how much revenue full-time employees (or the equivalent of full-time employees) generate for your organisation. The idea is to provide insight into how effective a business’s workforce is in terms of productivity and performance.
Why measure revenue per employee?
In simple terms, the revenue per employee ratio is designed to show the average revenue per FTE in your organisation. But at a deeper level, revenue per FTE is about revealing the organisational health of your business. In other words, how well your workforce is performing.
There are four important reasons to calculate revenue per FTE.
- It sheds light on how well your workforce is utilised and optimised. A higher revenue per FTE means your workforce is effective, but a lower revenue per employee ratio might indicate understaffing or overstaffing issues. This can be particularly revealing with FTEs and the average amount of revenue they generate for the hours they work.
- To identify growth opportunities where operations can be improved with more staff or resources. Perhaps a company needs extra staff to operate at full capacity, or more resources in specific departments which will increase revenue per employee.
- It can benchmark your company’s performance against industry standards or competitors. Revenue per employee benchmarks depend on multiple factors such as the industry and company size (more on this later), which you can use to determine whether your business is operating competitively or not.
- Drives better decision-making, in terms of resource allocation, staffing, and hiring practices. Where to hire, who to hire, or investing in and assigning better resources to allow teams to be more efficient and productive in their roles.
These reasons aren’t useful as a one-off, though, meaning you can’t just calculate revenue per FTE once and expect it to reveal all. It’s a metric most useful when measured continuously over time, allowing you to track trends and patterns in the productivity and efficiency of your workforce. This way, you can make informed decisions about human capital and resourcing.
And, while it’s important to measure your revenue per employee, it also doesn’t exist in a vacuum. This metric alone won’t tell you all you need to know about the health and efficiency of your workforce, or even all the factors behind why your revenue metric is what it is. Perhaps your average revenue per employee is low not due to overstaffing, but employee engagement. To find out what the true underlying causes are, you need to use your revenue per employee metric in tandem with others to understand what’s really going on.
This is why here at Acorn, we’ve created the first ever performance learning management system (PLMS). It’s a dynamic AI-powered platform for L&D experiences synchronised to business performance, by presenting contextual learning opportunities that empower people to grow and excel in the ways that positively impact organisational outcomes.
Factors that affect revenue per FTE
An average revenue per employee benchmark ranges wildly across different businesses, because setting a standard for it isn’t a simple cut-and-dry process. It’s a metric that can be influenced by a number of factors that you’ll have to identify and understand if you want to get the most out of it.
- Industry: You wouldn’t compare software and technology companies to retail stores when measuring revenue per employee, because employees in retail don’t have the same ability to directly impact profit.
- Company age: Younger organisations tend to have lower revenue and profit margins than established companies. Comparing revenue between young and old businesses in the same industry is a good way to benchmark where you should be.
- Company size: A smaller workforce may have fewer resources available to employees to help them perform their jobs effectively, decreasing their productivity potential.
- Productivity and efficiency: If your workforce lacks the right capabilities, resources, or has low employee engagement, productivity and efficiency decreases, causing lower revenue.
- Technology: Workplaces can become more efficient with technology to help streamline and automate processes that employees would otherwise have to do themselves. If used correctly, it can also increase the accuracy in those processes and improve revenue.
- Talent: Competence in capabilities affect the revenue an employee generates. Employees who lack the skills, knowledge and expertise needed to perform their job roles effectively will generate less revenue for the company than capable, high-performance employees.
- Sales and marketing: It can be as nuanced as not having the right marketing, meaning your brand or services aren’t going to be as well known. Organisations need effective market strategies to bring in customers to buy and consume your product or services, revenue for the business.
How to calculate revenue per FTE
FTEs are the equivalent number of employees working full-time hours, which means your revenue per FTE isn’t necessarily the same as your revenue per employee. So, if you want to find your revenue per FTE you first need to understand two things:
- The specific time period you want to measure for
- How many full-time equivalents you have employed over the time period.
The time period could be a financial year, a quarter, or even total revenue generated over several years. Let’s say you’re looking to find the total revenue per FTE over a specific year.
Full-time employment is generally considered be 2,080 hours worked across the year, or 40 hours a week. To find the number of FTEs you need to divide the number of hours worked by non-full-time employees across the year by the hours expected of full-time staff.
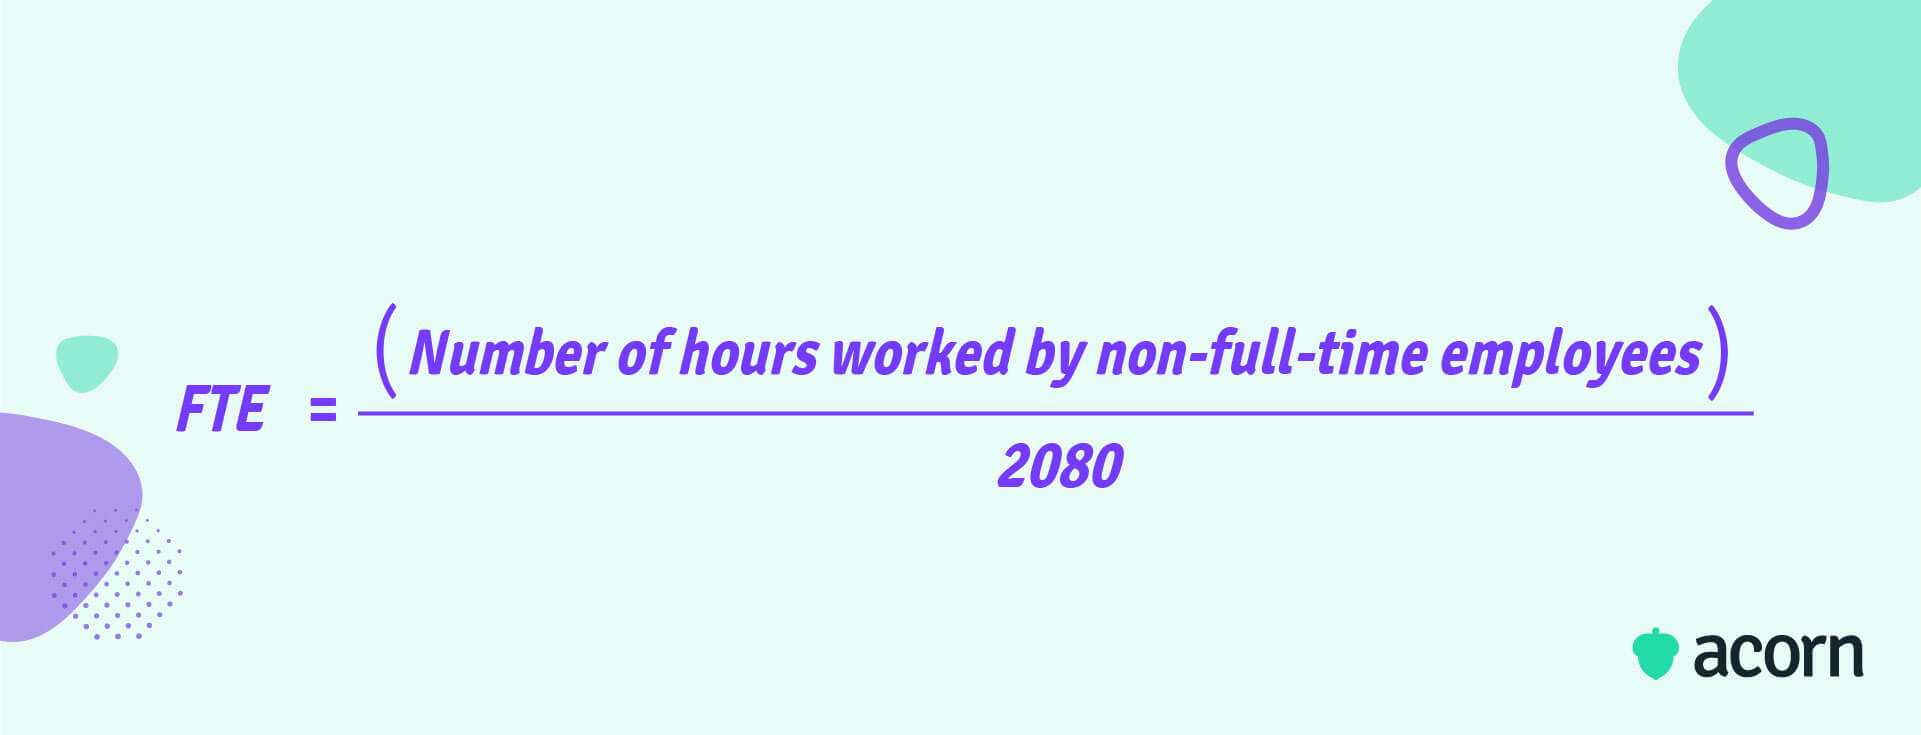
If your company has 12 part-time employees and they each work 20 hours a week, then they collectively work 12,480 hours across the whole year. So, 12,480 divided by 2,080 is six, meaning that your 12 part-time employees are the equivalent of six full-time workers. Add that to the number of full-time staff employed, and you have your total FTEs. If you have 50 full-time staff, then you have 56 total FTEs.
Now, onto the fun part. Your revenue per FTE employee formula is a simple one: The company’s total revenue over the specific time period, divided by the total number of FTEs.
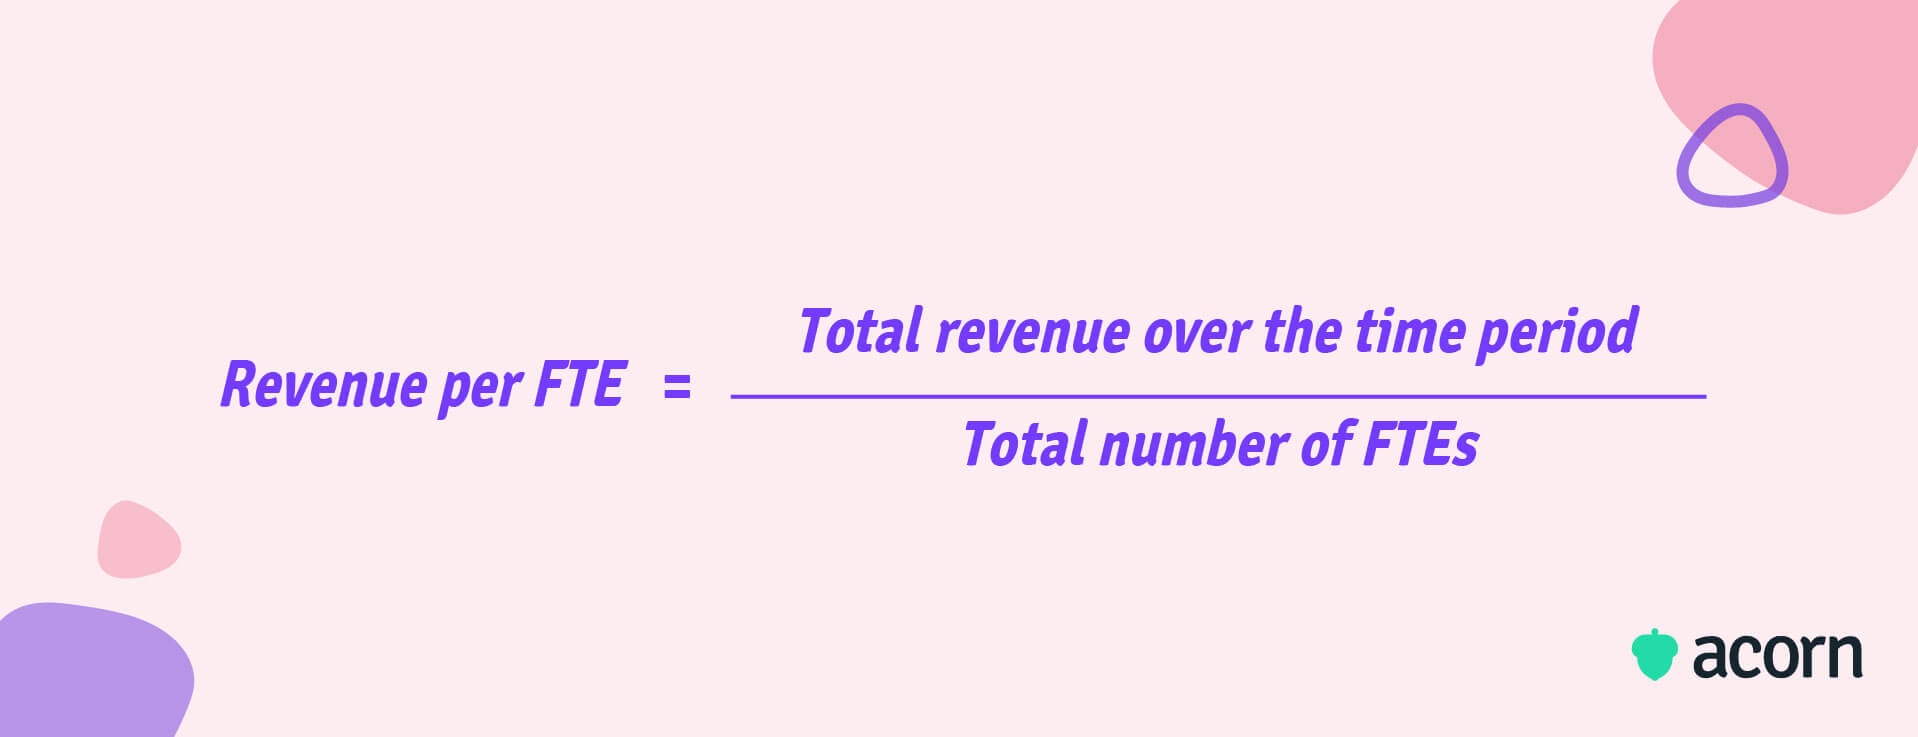
If your company’s total revenue over the year was $5,000,000 and your total FTEs were 56, then your total revenue per FTE for the year is $89,285.

Best practices for improving revenue per FTE
So, you know what influences it and you know how to measure it, but how do you improve your revenue per FTE? We’ve compiled a list of some of the best practices for increasing your annual revenue per employee.
- Offer learning and development opportunities to employees, allowing them to keep on top of industry trends, improve capabilities and performance, and work on their professional development.
- Improve hiring practices and get talented employees in from the get-go, requiring less overall training and improving time to proficiency (and therefore, time to revenue).
- Use technology to automate some processes, allowing employees to streamline their focus on higher-level tasks.
- Encourage collaboration and teamwork among the workforce to promote a culture of continuous learning. Increased communication and collaboration builds trust and promotes efficiency in the workplace.
- Focus on customer satisfaction and understanding what customers want, allowing you to build trust around your brand and ultimately attracting new customers, increasing revenue.
- Consistently track performance with KPIs to identify areas for improvement, that, when addressed, will improve your company’s overall revenue and revenue per employee.
Key takeaways
When calculating revenue per FTE, it’s important to remember to do it alongside other metrics. This allows you to identify the underlying factors affecting your revenue per employee and identify and address areas for improvement.
Most importantly, you need to remember to track your revenue per employee over time, as this is where you’ll see the ongoing trends in your workforce that affect your business health and efficiency.