How to Benchmark and Calculate Revenue Per Employee
Reading Time:

Lead the pack with the latest in strategic L&D every month— straight to your inbox.
SubscribeRevenue per employee is the first step to understanding opportunities for improvement in your business.
It’s the age-old question: Is your organisation’s workforce as efficient as it possibly can be? Knowing how much value each employee brings to the organisation as a whole helps businesses with their resourcing, headcount, and decision-making.
This is what revenue per employee is for. In this guide, we’ll show you how to calculate your revenue per employee ratio and what that means for your organisation.
What is revenue per employee?
Revenue per employee (RPE) is an HR and finance metric to track revenue generated by each employee. It’s used to evaluate productivity and profitability of an organisation and compare it against companies within the same industry. The higher your revenue per employee, the more each employee contributes to the company’s bottom line. On the other hand, a low employee revenue ratio might indicate that a company isn’t utilising its workforce effectively.
Why is revenue per employee important?
Human resources professionals can gain valuable insights into an organisation, its workforce, and its performance by utilising a combination of HR metrics. A business’s RPE is one of these, used to highlight the effectiveness of the workforce and areas that require optimisation, paving the way for “good” RPE.
Unsurprisingly, a good revenue per employee ratio depends on a company’s industry, size, maturity, and the revenue generated, so the importance of specific numbers varies. But there are a few universally important benefits to RPE that drive desired organisational outcomes.
Understand performance and productivity
Calculating individual revenue reveals where there may be inefficiencies in your organisation that effect performance and productivity, prompting companies to investigate the possible causes. The revenue per employee metric might not show specific employee productivity or performance, but HR and managers can use it to measure average revenue generated business-wide as well as the performance of individual teams.
This provides a clearer picture of how well the moving parts of the organisation are operating, and how well (or badly) you’ve utilised employees and their capabilities. Say you want to measure the revenue per employee of individual teams, and one team far exceeds others. You can evaluate which factors contribute to the team’s success and apply those to other departments in your organisation to increase organisation-wide revenue per employee, increasing performance and productivity.
This is why we created the first performance learning management system (PLMS) here at Acorn. It captures the impact of learning on business performance (and therefore, revenue). A PLMS guides learners step-by-step to master the role-specific capabilities they need to perform their roles efficiently and generate more revenue for the company.
Just remember it’s not a measure-once-and-be-done kind of metric, though, because it doesn’t show you all that you need to know about performance or productivity, even within a specific team.
Why is this? Revenue doesn’t have a fixed rate. Perhaps revenue for a sales team drops over a holiday period, or during the summer. This isn’t necessarily an indicator of poor performance from a team—rather, it’s a reflection of the natural wax and wane of workloads throughout the year. Employee turnover can also skew RPE. When you identify the areas where your organisation may be lacking, you can set actionable targets to improve productivity and performance, increasing RPE.
Analyse competition
Operational inefficiencies can be easier to spot when comparing revenue to different companies in the same industry. Benchmarks and acceptable RPEs vary between different companies and industries. You wouldn’t compare the RPE ratios of software and technology companies any sooner than you’d compare apples to oranges, but you can compare the RPE of different tech companies to each other.
So, if you compare your company’s revenue per employee ratio to similar companies in the same industry, you’ll be able to see where each business excels. If a competing business has a higher revenue per employee than yours, that indicates they may be more efficiently allocating resources or capabilities within their workforce. It could be a good sign to evaluate and implement similar tactics in your workforce to help improve revenue and build opportunities for business growth.
Plan your workforce
Lower revenue per employee ratio suggests that your workforce isn’t being efficiently utilised, or that there needs to be improvement in how resources are allocated. If you don’t have enough employees, your workforce might be experiencing burnout under high workloads, lowering your revenue per employee. On the other hand, if you have too many employees, there might not be enough of a workload to accommodate them on top of the costs per employee, meaning you could keep the same total revenue but have fewer employees.
This is called workforce planning. It’s designed to get the right people in the right jobs at the right time to deliver on your business strategy. This doesn’t just have to be about hiring the perfect candidate from the start, but developing your workforce into the employees you need them to be. This could come in the form of providing relevant and effective training, realistic budgeting, or improved workplace culture to ensure an engaged and capable workforce. Done currently, you can reduce expenses and maximise profit margins, increasing your revenue per employee.
How to calculate revenue per employee
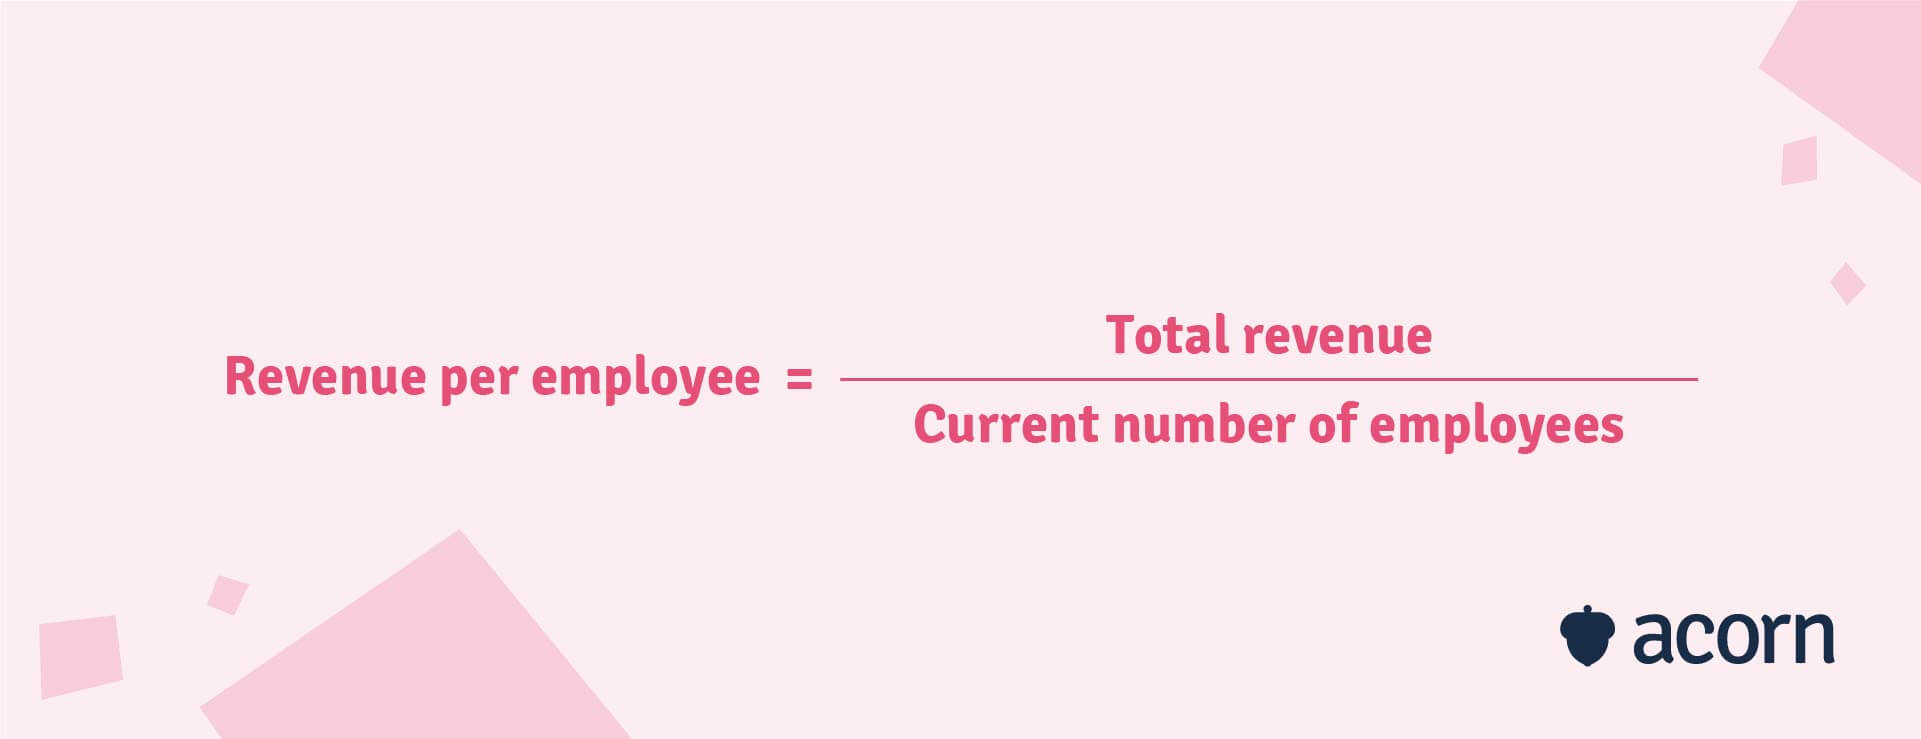
To determine how much revenue each employee generates in a specific time period, you first need to know two things:
- The organisation’s total revenue
- The total number of current employees.
These figures will become part of your revenue per employee formula:
For example, calculating revenue per employee can be done in three steps:
- Find the company’s total revenue. Look to your company’s financial statements or annual reports. If you want to find your average employee revenue for a specific year, you need to use your annual revenue. Let’s say that Company A saw a total of $5,000,000 in revenue that year.
- Determine the total number of employees. That’s the total number of employees currently employed at your company rather than the average number over the year, and includes temporary, part-time and full-time employees. This is what makes the revenue per employee ratio a rough estimate rather than an exact science, as employee turnover can skew the average revenue per employee either way. Let’s assume that Company A has a total of 100 employees at the time of calculating.
- Divide annual revenue by the total number of employees to find the revenue per employee for the given period of time.
If we plug those figures into our revenue per employee formula, we get:

In simple terms, each employee at Company A contributed an average of $50,000 in revenue during that time period. If Company A were to continue to track this metric over time, they would be able to compare revenue per employee year on year to see how much they improve (or don’t improve) workforce efficiency.
Let’s look at another example. Say Company B operates in the same industry and also earned $5,000,000 over the same period. But, unlike Company A, Company B has a total of 1000 current workers. Their RPE would look like this:

Which makes their revenue per employee $5000—ten times less than Company A.
The impacts of not calculating it
There are several negative impacts on your business if you don’t calculate RPE.
- Falling short of industry benchmarks. Some suggest that a good revenue per employee benchmark ranges from $43,000 per employee for companies making $1,000,000 or less to $230,000 for companies making $50,000,000 or more. Imagine if Company B doesn’t calculate their RPE—they won’t have any idea that they’re performing 10 times worse than their rival, Company A, and won’t be able to investigate and identify areas for improvement. In other words, Company B won’t prioritise improving their practices, leading to increased turnover, decreased productivity, and operational inefficiencies, driving up costs and wasted resources.
- Inability to make improvements. When RPE isn’t calculated, wasted resources, operational inefficiencies, and even poor workplace culture crop up, leading to low engagement, low revenue, and high employee turnover. If Company B doesn’t adapt and evolve because it lacks the necessary information, it well be left behind in the competitive market. In short, Company B won’t be able to innovate effectively when they’re operating from a productivity lag, leading to higher costs, lower performance, wasted resources and bad business outcomes.
- Decreased financial outcomes. Just like ROI, revenue per employee is one of the financial metrics that highlights the monetary value a business gains as a result of its workforce and its capabilities. Not finding RPE makes it more difficult to make informed and actionable decisions around resource allocation and business strategy, leading to increased costs and inefficiently-allocated spending.
Key takeaways
Revenue per employee isn’t about calculating the revenue generated by individuals or finding your most talented employees. It’s about understanding the average amount of revenue per employee within smaller teams or the organisation as a whole, to help identify potential inefficiencies in your workforce.
The higher your revenue per employee, the more efficiently your organisation is operating. You can use your RPE to deepen your understanding of improvement areas in:
- Improvement areas
- Performance and productivity
- Competitors
- Workforce planning.